Performance Report: 04/30/2022
All performance data for our strategies is net of all fees and expenses. All performance data for indexes or other securities is from sources we believe to be reliable. All data is as of 04/30/2022.
Investment Strategy
MAP Strategy
S&P 500 Index2
Balanced (AOM)2
Global Balanced2
Apr Return
(2.3%)
(8.8%)
(5.4%)
(6.1%)
YTD
5.0%
(13.3%)
(10.6%)
19.7%
Since Inception1
39.5%
39.5%
12.1%
12.8%
April was a miserable month for the stock and bond markets. We fared much better than others although we were not completely immune to the widespread declines. Our losses were muted and we still have a strong YTD gain right at 5%. Since inception, our MAP strategy is basically even with the S&P 500 but with only one-third the risk. Our returns are more than three times our benchmark fund (AOM) with slightly less risk. It is during market declines that our MAP model really proves its merit. A combination of strict risk management plus the inclusion of securities that are truly non-correlated with the S&P 500, gives us the opportunity to generate positive gains even when the stock and bond markets are falling.
While the carnage in the S&P 500 looks bad, the worst annual start for the index since 1939, it was even bleaker for investors in traditional portfolios. The NASDAQ had its worst month since the 2008 Financial Crisis and is down over 20% YTD. TLT, a popular long-term US treasury bond fund, is down nearly 20% YTD. Speaking of which, bonds which were tabbed as the "diversifier du jour" for equities, have now fallen for four straight months. This year is proving tragic for those allocating money to bonds for the sake of bailing out equity weakness. Conversely, we have sought out securities that were exhibiting little to no correlation to the S&P 500 for the sake of diversification, thus we are doing much better.
Two areas that did appreciate this month were agricultural commodities and the energy space. Fortunately, we continue to hold a significant allocation to the ag space but our energy exposure was minimal this month. In fact, we experienced mild losses in the few energy names we held. If it were not for gains in our ag positions, our performance would have looked more like the rest of the markets.
A surprising development this month was that gold and silver fell alongside bonds and stocks. In my update two months ago, I wrote how January and February were the first time in my professional career that bonds and stocks fell in unison. Well, never to my knowledge have all three core components of a truly diversified portfolio fallen in unison. Thus, April was a truly unique market environment.
As I watched the markets play out in April, I have grown increasingly concerned. While some indexes like the S&P 500 have "traded in a range" for the past seven months, the activity inside that range has been terribly volatile. Indexes bouncing or falling the likes of 2% each day tells me there is a real battle between fundamental bears and fiscal bulls. This past month, the battle took center stage across some very high-profile stocks. In April, NFLX crashed 35% in a single day, while AMZN, one of the world's largest companies, fell over 14% in a single day. On the winning side, FB popped over 17% in a single day but was still down for the month and is down over 33% for the year. How does a stock pop 17% in a single day and still be down for the month?
These were the stocks that made the headlines but I saw the similar erratic behavior in smaller names, even a few we owned. One area that hurt us this month was uranium. Over time, we have seen big gains in the uranium space but we took a hit this month. UEC, one of my favorite plays in this space, fell over 30% in just a few days. So while we saw profits in contrarian themes like the ag space, we saw some losses in higher-beta names like the uranium stocks. Further, our strict risk management led to some positions in the energy space being stopped out that eventually rebounded. But that is a small price to pay for the sake of minimizing losses over time.
Market Developments Worth Watching
For several years, I have claimed that two things would take place before the equity markets would be in real jeopardy.
1) Bonds and equities would have to fall at the same time. Check!
2) The USD would have to decline in a time of market panic. Not quite yet.
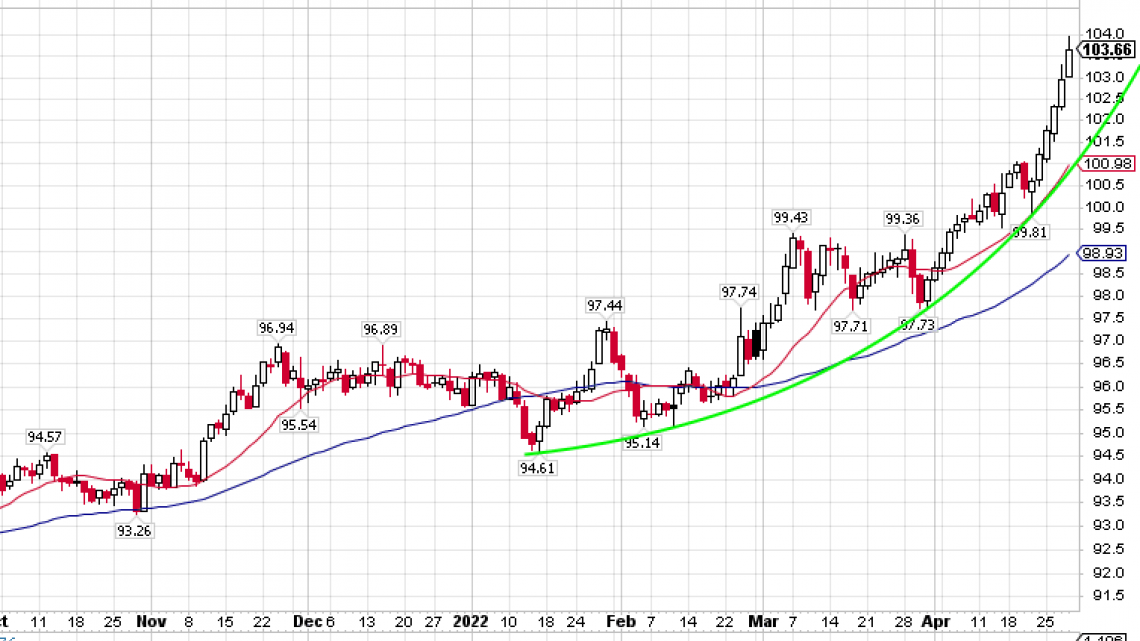
The first box has been checked but the second still has not taken place - at least not in an obvious way. In fact, the USD index has experienced a remarkable run over the past 16 months as the world continues its economic recovery from Covid. Recently, the USD index has gone parabolic as you can see in the chart below.

The USD index is mostly comprised of Euros, Yen, Swiss Francs and a handful of other currencies from developed countries. And these currencies are not doing well versus the USD. But if we look at emerging markets, we'll see that some of their currencies are doing quite well versus the USD. The Russian Ruble, of all things, has actually appreciated versus the USD this year. So has the Brazilian REAL. The Canadian dollar has depreciated versus the USD but only modestly. The same goes for the Australian dollar.
The Wall Street consensus for the past few decades has been that any weakness in the USD will be a result of foreign nations seeking to replace the USD with another reserve currency. The most likely prospects have been the Euro (EUR) or the Japanese Yen (JPY). And more recently, there have been whispers that the Chinese Yuan/Renminbi could play the role as the world's reserve currency.
But what if Wall Street is looking at it all wrong? What if nothing replaces the USD as the world's reserve currency but rather each nation starts using its own currency as its primary trading currency? What if a country like Australia or Brazil starts to use its own dollar versus the US Dollar to engage in trade with other nations. Currently, if an oil and gas company in Australia or Canada or Brazil, wants to buy oil from Saudi Arabia or the UAE or Kuwait, the transaction is completed in US Dollars (USD). This state of international trade is referred to as "Petrodollar Hegemony" and was established by a unilateral agreement between Saudi Arabia and the US back in the 1970's. And because oil was only traded in USDs, it became easy for everything else to be priced in USDs. So if somebody in China wanted to buy sugar from someone in Brazil, the transaction was most likely done in USDs. And the transaction was likely processed through the USD-dominated SWIFT system.
Now we are seeing the first substantial economic power, Russia, abandon the USD. They have demanded that all their oil be priced in their own currency. And several countries have started to comply with their demands. There are some contractual issues in place keeping Russia from being paid solely in Rubles but they have made a clean break from the USD.
As of now, the USD is doing well against most currencies. But as more and more countries seek to break ties with the USD, it may not hold up as well. While I think it's critical to keep tabs on the USD index, it may be just as critical to watch how currencies outside of the USD index are doing relative to the USD. Ultimately, If equities, bonds, and the USD all fall in unison, then it may spell real trouble for traditional investment portfolios. So I'm watching the USD closely and not just the USD index. If this "box is checked" I will position our accounts even more defensively and look to include even more securities that are non-correlated to the S&P 500.
As always, please do not hesitate to contact me with questions or concerns about your account.
Best,
Matt M.
1. Since inception date as of 5/1/2019
2. All benchmark prices are obtained through Yahoo!Finance. S&P 500 index is calculated using the index price change. AOM is the iShares Core Moderate Allocation ETF. Global Balanced is 66.66% allocated to the performance of AOM AND 33.33% allocated to the performance of IEFA (iShares Core MSCI EATFE ETF).
