Performance Report: 05/31/2022
All performance data for our strategies is net of all fees and expenses. All performance data for indexes or other securities is from sources we believe to be reliable. All data is as of 05/31/2022.
Investment Strategy
MAP Strategy
S&P 500 Index2
Balanced (AOM)2
Global Balanced2
May Return
(0.6%)
(0.7%)
0.0%
0.2%
YTD
4.6%
(14.4%)
(10.7%)
(11.4%)
Since Inception1
38.7%
38.4%
12.1%
13.0%
Our MAP strategy and the stock market experienced mild losses this month. Bonds were a mixed bag with Treasuries declining for the sixth straight month but corporates appreciated ever so slightly. International equities experienced mild gains. Our YTD appreciation is in the mid-single digits while traditional investments are still deep in the red, but we have seen modest declines over the past couple of months as capital markets started to deleverage.
In the early part of the year, capital markets were responding to fundamental trends that started to take shape over the past year, largely a significant increase in inflation and subsequently a semi-significant increase in interest rates. And as long as something is going up, it is my job, or more accurately, the MAP's job to find these securities and then I invest in them for you. But starting in April, "the baby was thrown out with the bath water" and just about everything started to decline. As I stated in my last update, I have never seen stocks, bonds, and gold decline in unison, and those trends continued for the first half of May. Deleveraging takes place when leveraged investors are forced to sell "whatever has a bid" regardless of fundamentals in order to meet margin calls. Thus, many of the themes we owned declined in the past couple of months.
Deleveraging is not all that common. The last major fits of deleveraging were the Covid crash in 2020 and the fall of 2008 during the height of the Financial Crisis. If deleveraging continues, which I don't think will be the case in the near term, things could really get ugly, really quick. But again, I don't expect that, especially in the near term. Furthermore, the themes currently dominating our strategy are largely contrarian meaning the securities we hold are not widely held by the broad investing community so the past couple of months could have served to shake out the weak while the resilient should remain steadfast.
While the markets inflicted some pain on us the past couple of months, it could have been far worse had it not been for my approach to risk management. While the S&P 500 is down nearly 10% the past two months, we are only down 3%. The stock market experienced extreme intra-day volatility nearly all month despite closing nearly flat. The average intra-day swings in the S&P 500 were over 2.5%. So the past two months have been incredibly challenging. I feel blessed to have our MAP system to navigate such volatility. And do I expect more volatility to come but the worst may very well be over for now.
Market Developments Worth Watching
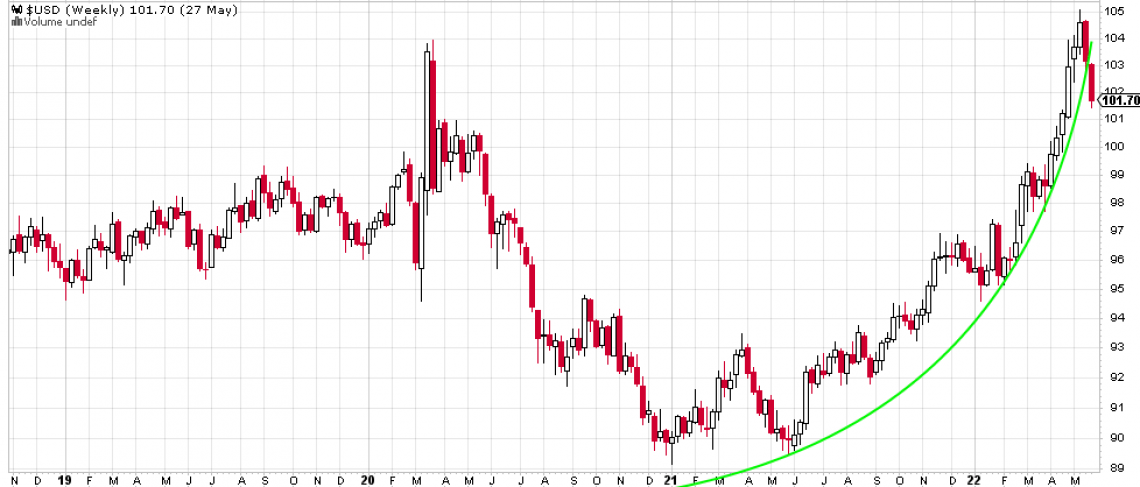
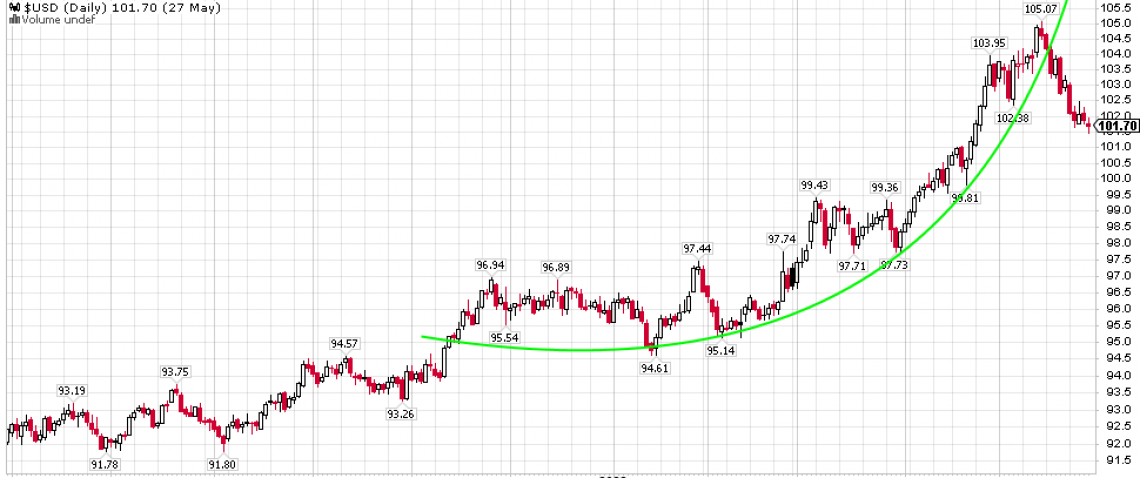
While there is a host of indicators I'm watching, I believe there was a potential development in May that stands out in importance. Over the past two years, the US Dollar index (USD) has carved out a well-defined parabolic curve. Parabolic curves typically are a sign that everyone is moving to one side of the trade. This curve nearly brought the USD to parity with the Euro for the first time in decades while achieving a multi-decade high versus the Japanese Yen. The appreciation of the USD relative to other well-established currencies has been impressive. But this month, the USD declined and broke through the parabolic curves on both the weekly and daily charts. Here are both charts.


One of my fears is the idea that after 50 years of exporting copious amounts of monetary inflation manifested in the form of massive trade and budget deficits, the US will find it increasingly more difficult to export inflation as our trading partners will become increasingly less willing to accept USDs in exchange for foreign-made tangible goods. Makers of foreign goods that cost money and require labor to create may no longer accept US paper, or its electronic equivalent, which virtually costs nothing to create and requires no labor. And as a consequence, the US economy will either need to absorb its own inflation or quit creating monetary inflation. If this plays out, the good news is manufacturing will to return to our shores. In order for this thesis to materialize, the USD will have to be discounted relative to the currencies of its trading partners. And at some point, the USD could lose its status as the world's reserve currency.
The easy counter-argument to this thesis is that no other currency garners sufficient strength to assume the role of the world's reserve currency. And I entirely agree with this argument. The misguided EU experiment is on the verge of collapse and the Euro currency is likely to go with it. The Japanese Yen is in deep negative real-rate territory making it terribly unattractive. And China is deemed too corrupt to trust. So whose currency could possibly replace the USD?
But what if, there is no replacement for the USD as the world's reserve currency. What if countries simply demand payment in their local currency, like Russia is already doing. Like India and some others have started to do. In a fully computerized, highly-connected world, why can't transactions be instantaneously converted to local currency? Why must an Australian miner sell raw materials to a Chinese manufacturer in USD's? Why not just use renminbi or Australian dollars? It would eliminate several levels of currency risk and a decent bit of hassle. Yes, the well-established SWIFT system funnels transactions into USDs but it could easily be changed to affect transactions in local currencies or another more fluid system could be created. And ultimately, in a world with a compromised supply chain, the supplier makes the rules. And if the supplier wants to be paid in his or her local currency, or some other currency like gold or bitcoin, then he or she is at liberty to demand it.
Another viable option is for international trade to simply turn to digital currencies. While cryptos are an option here, I'm leaning towards the development of digital currencies like China is currently implementing. Most all of us use credit cards or other electronic means of payment, what does it matter if that electronic payment has a $ or L or Y in front of it. If I can buy goods using Paypal or bitcoin, why couldn't I use e-yuan.
Ultimately, the FED is dependent on a strong USD. If the USD falters for the reason I propose or for any other reason, the FED is hamstrung to affect capital markets in their favor as they have the past three decades. I don't believe markets are in jeopardy of such a tectonic shift taking place just yet. And with any luck, this development may never take hold. But I do believe the "canary in the coal mine" will be the price of the USD relative to other currencies. As for now, I believe the USD is simply correcting its strongest rally in over a decade. Every time the stock market declines, the USD has been a buoy for risk-averse investors. So this counter-trend move could be a result of the inevitable development I have addressed, or, it could simply be a result of risk-averse assets being converted to "risk-on" investments.
The key development to watch in the future is whether the USD begins to fall alongside the US equity markets. If this happens and does so in a meaningful way, then my thesis will be proven true. But as long as the USD declines when US equities are rising in price then it is nothing more than a risk-off to risk-on trade. Thus far, it is looking like Wall Street has contained the deleveraging and equity markets are likely to find support and rise in the near term.
Conclusion
I am speculating the USD will continue to provide hints as to where US equities are headed. But what does not require speculation is the ongoing battle between fiscal bulls and fundamental bears. The extreme intra-day volatility in the equity markets should have our acute attention. If there are any investors who are not scared of what could possibly be on the horizon, then they are not paying attention. The volatility present in the market clearly tells us that leverage is gripping the market tightly. Leverage is a wonder on the way up but can be devasting on the way down.
This leverage could cause a "moonshot" in equity prices if certain fundamental issues are resolved. But if inflation remains stubbornly high and the stock market continues to decline, the leveraged bets will need to be unwound. And if they are, it won't be pretty. This is where my MAP system really proves its merit. I'll continue to buy securities judiciously but if markets experience more deleveraging, as they did in April and the early part of May, our stops should limit our losses. If the fiscal bulls win this battle, hopefully, we will participate in a meaningful way. I highly doubt we'll keep pace with the S&P 500 point for point, but we should see gains commensurate with a balanced portfolio.
I am confident the most important thing I can do for you over this market cycle is to control losses. Most bear markets last at least 18 months so odds are we have a ways to go. Yes, I'll continue to add exposure using the MAP. Last year, I started to shift our security list to counter-cyclical names which has paid dividends thus far this year. So we have quite a few ways to profit even if equity markets continue to decline, assuming deleveraging doesn't take hold again. And in all bear markets, there are tradeable moves to the upside which the MAP is well equipped to take advantage of. These are the reasons I lean on the MAP so heavily. It will provide us short-term opportunities that I could never detect on my own and it allows us to enter long-term positions with a small amount of risk. And if I'm wrong on the long-term prospects of a security, it bails me out with my adherence to our strict risk management protocols.
As always, please do not hesitate to call me at 512-553-5151 if I can be of assistance.
Best,
Matt McCracken
1) Inception date of 4/30/2019
2) All benchmark prices are obtained through the Yahoo!Finance website. S&P 500 Index is calculated using the index price. AOM is the iShares Core Moderate Allocation ETF. Global Balanced is calculated by adding 2/3 of the performance of AOM plus 1/3 of the performance of IEFA (iShares Core MSCI EAFE ETF).
