Ring the bell! Its finally here. Potentially, a multi-year top in equity markets. The universal curse has finally reared its ugly head. And no other than CNBC's finest Bob Pisani is the one to usher in the next bear market. This from CNBC today:
September is the toughest month for stocks, but this time could be different
I didn't know if these dire words would ever surface again. Everyone knows on Wall Street that the "its different this time" narritive is blashphemy. Perhaps not even the curse of the Sports Illustrated Cover is a more accurate and precise precurser of doomsday. I am shocked this headline got pas the editors.
Not only is September an historically harsh month for equities, but we are entering a 7 year cycle that is historically harsh for equities.
In addition to the bearish cycles in place for US equities, there is a strong technical case one could make for lower equity prices in the near future.
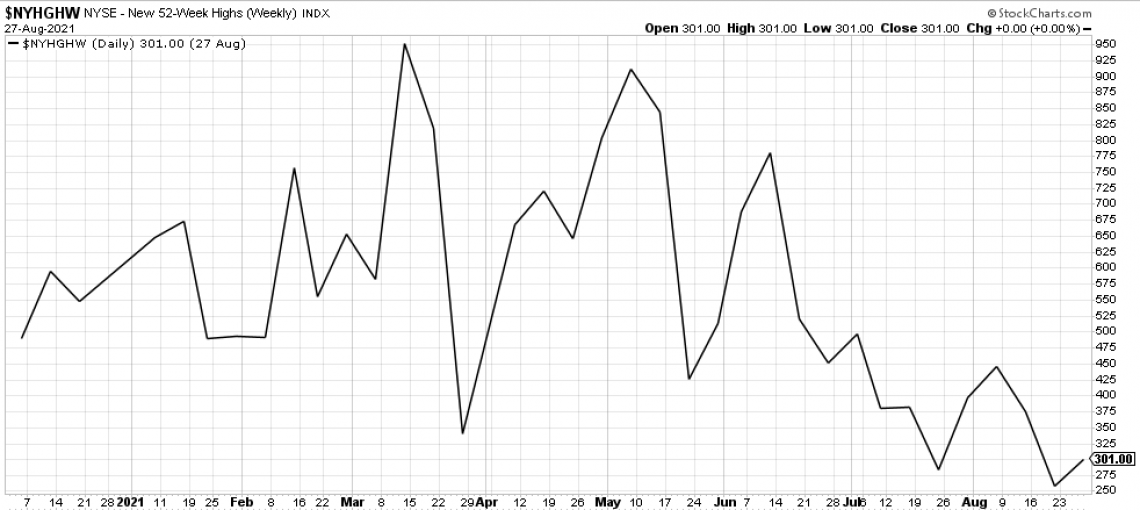
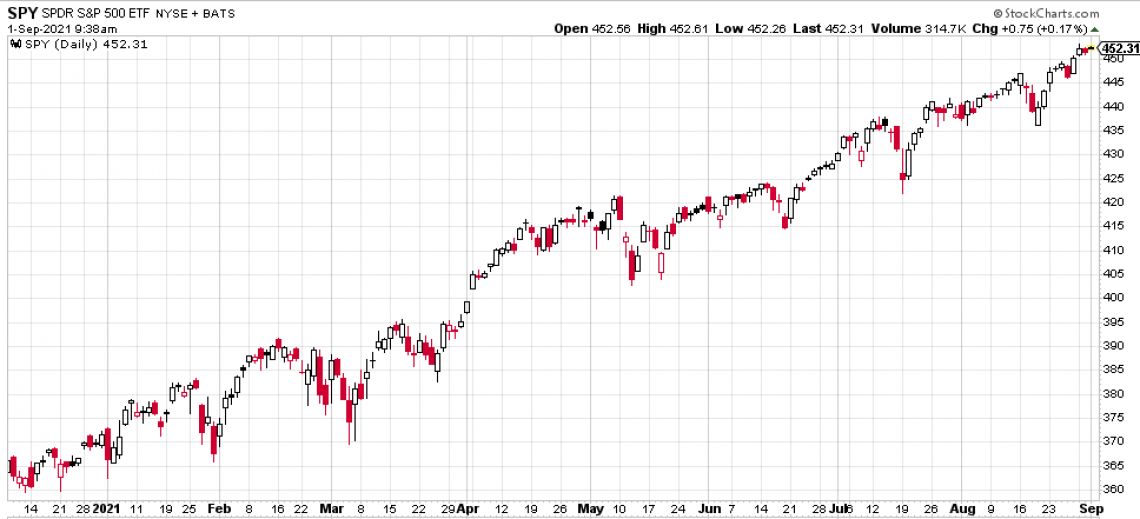
Years ago, I subscribed to James Stack's Investech research. And one of his favorite indicators for indentifying an inflection point was to guage "market breadth". And one way he would measure it was to study new 52-weeks highs. When the number of new highs diverged from the broad based indexes, he argued a market top was nigh. And such a divergence is now taking place. New 52-week highs on the NYSE peaked at over 900 in March. Since then, the SPX has continued its march higher while the number of new highs has collapsed. Even while the SPX closes each day at a new all-time high, the number of NYSE 52 week highs has been holding for the past month in the neighborhood of 300, a mere one-third of its March figure.


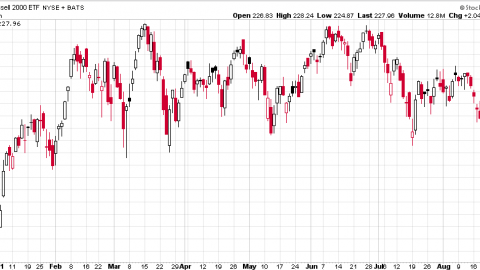
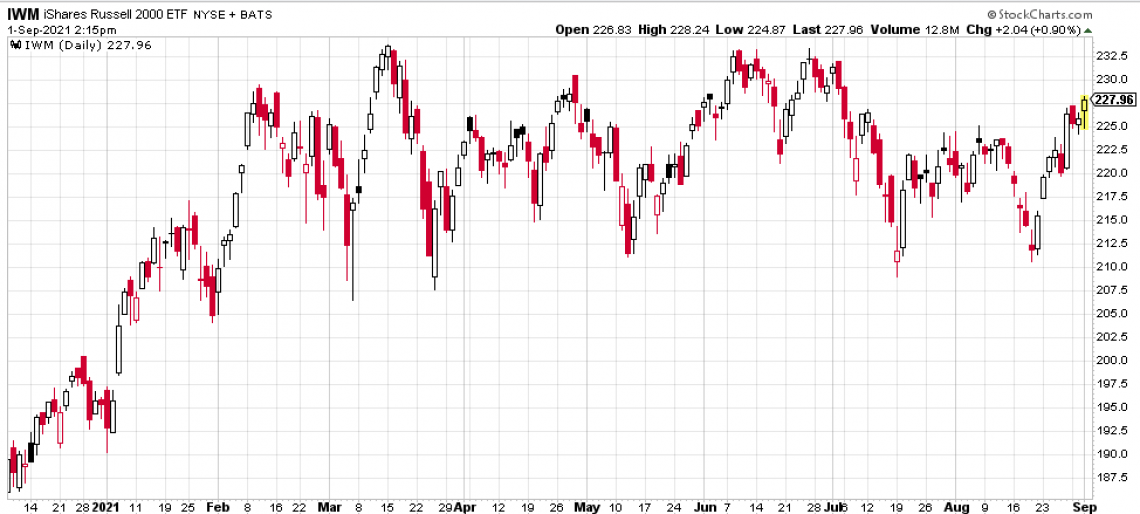
Another data point Mr. Stack kept a close eye on is the relationship of small and large caps. When there was a disparity between the two while large-caps outperformed small-caps, it was a sure sign market breadth was weak. And in this chart we see smallcaps, measured by IWM, as failing to best its March highs while the SPX has hit new high after new high.

Stack theorized that market breadth was key to measuring how healthly a market rally is. And when breadth was weak, a top was in the works. And he was spot in calling the '87 top and 2000 dot.com top.
Could it be different this time, as Mr. Pisani suggests. Absolutely. The FED is determined to keep printing money establishing a perpetual bid under the market. The "Greenspan put" is alive and well and never has it been utilized to this effect before.
Conversely, at what point does reckless money printing lead to a) diminishing returns and b) inflation. Obviousily, we have inflation but at what point does the bond market start to accurately price yields inline with inflation? What if bond yields revert from their negative real rate state to providing a positive real return? What happens to equity prices when bonds start yielding more?
