Performance Report: 03/31/22
All performance data for our strategies is net of all fees and expenses. All performance data for indexes or other securities is from sources we believe to be reliable. All data is as of 03/31/2022.
Investment Strategy
MAP Strategy
S&P 500 Index3
Balanced (AOM)3
Global Balanced3
YTD Return
7.5%
(5.5%)
(5.6%)
(6.1%)
Since Inception1
42.8%
52.9%
18.5%
19.7%
RARR2
4.60
2.61
2.31
1.33

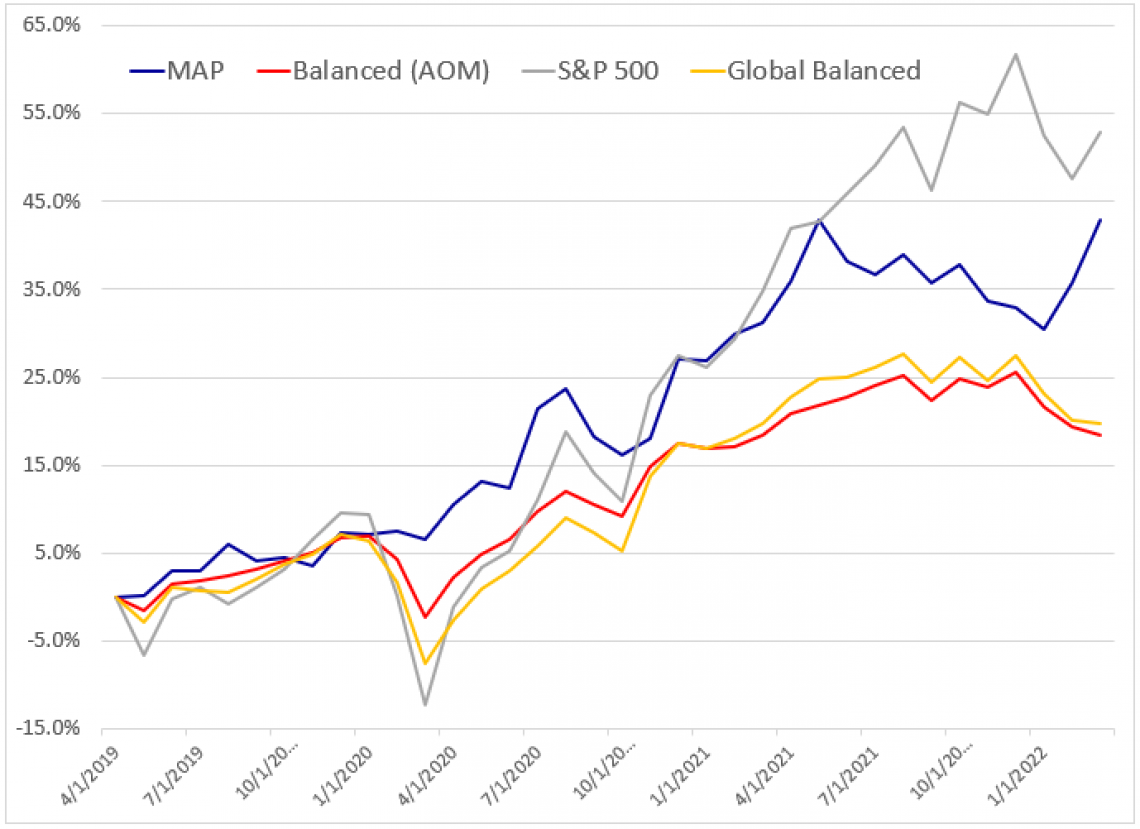
March was another really good month for us with my strategy appreciating just over 5%. We are approaching last year's high-water mark. In February, we gained in excess of 4% when the stock market went down and in March we gained in excess of 4% again when the stock market went up. A pretty remarkable accomplishment! I can't promise to replicate these results consistently but I feel blessed to be able to do so this year.
Since inception, my managed strategy continues to best our benchmark, the iShares Core Moderate Allocation ETF (AOM), by a wide margin. Based on our proprietary measure, our strategy is now delivering twice the "risk-adjusted returns" as our benchmark! While we have experienced strong gains this year, the benchmark fell every month this quarter. Even with S&P 500 appreciating in March, bonds across the board continued to fall dragging down the performance of AOM. The great majority of managed accounts are constructed based on the same Modern Portfolio Theory concepts as AOM, so if AOM is struggling, so are the great majority of investors.
Hindsight is always 20/20 and it is easy to look back and see that in 2021 my MAP system correctly identified inflection points in US equities, bonds and hard assets. However, it took longer than I expected for these changes in trend to emerge, and thus we struggled in the back half of 2021. Fortunately, the MAP system guided us correctly and thankfully, I had the courage and discipline to stick with its guidance.
The Better You Do, the Better I Do
In creating my firm, one of my chief goals was to minimize the overt conflicts of interest that are inherent to the industry. Since I established myself as a fee-only registered investment adviser, where my only source of income is you, the better you do, the better I do. And I take a great deal of satisfaction in knowing my interests are aligned with yours.
Last year, while my performance was not so hot, my wife and I worked out a system for communicating "how my day went". She has found that I, not unlike too many other members of the male human species, have a limited emotional spectrum that is basically restricted to just two emotional responses: Angry and Not Angry. So without having to ask me how my day went, I simply give her a thumbs up (i.e. not angry) or a thumbs down (i.e. angry). Well, this month, I had to add a "two-thumbs up" response. A "two-thumbs up" day is one where my client accounts make more in one day than I earn in fees in an entire year. This month, we had several "two-thumbs up" days.
We also had a couple of "two-thumbs down" days. Obviously, we had more UP days than DOWN days but I point this out because the underlying currents in the capital markets are becoming increasingly more turbulent. Volatility is a wonder while we are making money but can be gut-wrenching when we are losing money. The past year is a perfect example of how the MAP is really good at limiting downside volatility while seeking to maximize upside volatility. At this moment, the MAP is not giving me any hints that the current trends are in immediate jeopardy but all that could change in a day or two. I'll be "on my toes" constantly monitoring developments and eager to take profits if needed. I know I won't get out at the top, the MAP isn't designed to do so, but I want to protect the profits we have earned this year.
If you have any questions about your account or about our strategy, please do not hesitate to give us a call at 512 | 553 5151.
All the best,
Matt McCracken
1) Inception date of 4/30/2019
2) Risk-Adjusted Return Ratio (RARR) is a proprietary measure we developed to measure risk-adjusted returns. The ratio is calculated by adding the total of all monthly returns divided by the sum of all negative monthly returns, divided by the number of time periods since inception. This number is then multiplied by 100. The objective of our RARR calculation is to determine how much return a strategy has generated relative to the severity of its declines or overall risk.
3) All benchmark prices are obtained through the Yahoo!Finance website. S&P 500 Index is calculated using the index price. AOM is the iShares Core Moderate Allocation ETF. Global Balanced is calculated by adding 2/3 of the performance of AOM plus 1/3 of the performance of IEFA (iShares Core MSCI EAFE ETF).
