Performance Report: 06/30/2025
All performance data for our strategies is net of all fees and expenses. All performance data for indexes or other securities is from sources we believe to be reliable. All data is as of 06/30/2025.
Investment Strategy
MAP: Full ($500k+)
MAP - Plus
MAP - Balanced
S&P 500 Index2
Mod Alloc(AOM)2
Growth Alloc (AOR)2
May Return
6.2%
7.0%
3.8%
6.1%
2.8%
3.4%
YTD
13.2%
N/A
N/A
6.1%
6.6%
7.9%
Inception1
68.1%
N/A
N/A
108.3%
39.1%
55.6%
Sortino3
0.95
N/A
N/A
0.79
0.47
0.60
(Disclosure: We added performance figures for our new strategies just for this month, as any prior data will be inconsistent and potentially misleading. We will post continuous data for our full-size MAP Strategy since its inception on 5/1/2019. We use AOM and AOR as our benchmarks as they are low-cost index funds that model the exposure of the majority of retail investors. Our risk measures are aligned closely with these funds. It is important to note that individual account performance varies and your account may perform better or worse than its model. The model's performance is simply the average performance of all accounts participating in the model.
Performance Update
June was a very good month for us, especially from an absolute return perspective. The FED has been pumping an incredible amount of money into the capital markets and, as they say, "A rising tide lifts all ships." Despite a track record of low-risk returns, our full MAP and MAP Plus both bested the S&P 500 this month. And, June was a month in which the S&P 500 delivered half a year's worth of returns in just 20 trading days. On a YTD basis, we are beating just about any retail investment solution one could find.
For our newer clients, here's a quick word about how we measure "risk-adjusted returns". I use "The Sortino Ratio" as it, in my estimation, best captures alpha. Alpha is a term used to describe how much value a manager adds over the "risk-free" rate, which is commonly the interest rate on short-term Treasuries—or you could compare it to CDs.
I prefer the Sortino ratio as it puts an added emphasis on limiting downside volatility, without punishing upside volatility. Over my four decades in the industry, I've never heard an investor gripe about upside volatility. While measures like alpha and "The Sharpe Ratio" punish a manager for upside volatility, the Sortino ratio does not. If you wish to learn more about the Sorotino ratio, just click here.
Market Commentary
The only adjective I can use to describe the current stock market is bi-polar. I have never seen such incredibly bearish technical indicators while fundamental trends are deteriorating, and yet the stock market relentlessly pushes higher. Even as fundamentals collapsed in 2008, technicals held up until Q2—well after the market peak.
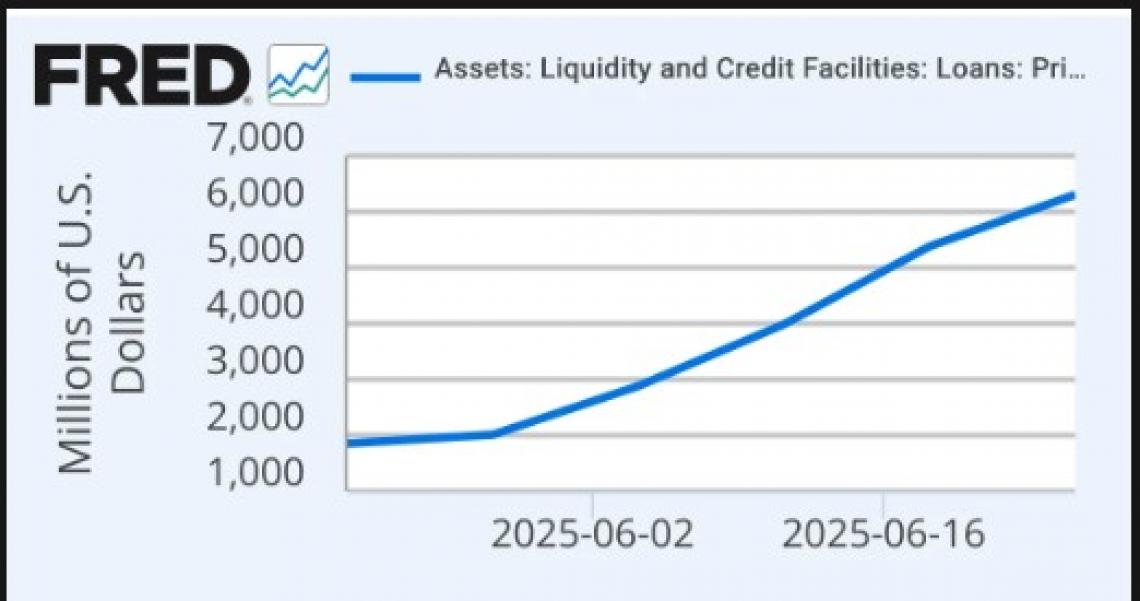
Current stock market leadership is languishing. I wrote a post about it last week, which you can read more about here. Market breadth is not as dire, but certainly not bullish. My proprietary MAP model, which measures money flows in and out of securities, is remarkably bearish on all the big stock market indexes including the S&P 500, the DOW, and QQQ. Major indexes appear to be setting up for a decline, yet are continuing to push higher. All of it can be pinned on a single phenomenon, which I'm calling "Covert QE". Over the past couple of months, the amount of money the FED has thrust into the capital markets has been truly outstanding. According to the Coastal Journal, the amount of money banks have sought from the FED's discount window increased 320% in June. Here is the chart:

The banks take this money and buy bonds, stocks, and derivatives. Add it all up and it is a force to be reckoned with. I call it "Covert QE" simply because the FED supposedly shut down QE years ago when inflation nearly hit double digits. The FED's monetary inflation influences price inflation. The old saying goes, "Monetary inflation always leads to price inflation." But for a period of 10+ years, through the careful manipulation of the derivatives markets, the FED was able to create a ton of monetary inflation without price inflation losing control. But, that changed post-COVID. Now the FED has to act like they are stifling money creation, all the while continuing to print more money out of thin air. This is all done in a continued effort to support capital markets, despite the underlying economy being in decline.
Below are links from some articles appearing on the IBKR Campus website this past month. They make a clear case that the economy is weakening, and yet the stock market continues to press higher:
Was There Really Any Doubt? | Traders' Insight
Momentum Trying to Outweigh Fundamentals | Traders' Insight
Stocks Not Fretting Payrolls | Traders' Insight
At this time, I'm as equally nervous to be in the market as I am out. But, I'm at ease knowing we have stops in place in case the market turns quickly. I'm consistently watching for any clue that the momentum in the stock market might wane. Tops tend to be drawn-out affairs, but, given the incredible volatility of the markets over the past few years, it is critical that I remain vigilant in my approach to risk management.
Conclusion
I feel blessed to have generated double-digit returns for my clients this year. For those of you who joined us recently, it is comforting to have a month like this to put everyone in the black. Risk management has always been my priority, and it will continue to remain that way. Since I started my MAP strategy in 2019, the S&P 500 has seen two declines in excess of 30% and one of 20%. A total of three double-digit declines across 5+ years have never occurred in stock market history. During that time, my full-size MAP strategy has experienced just a single decline in excess of 10%.
During the 2022 bear market, our peak-to-valley decline hit 17%. But, during the 2020 stock market crash, we were down just a few percent and closed the year with nearly a 20% gain. And, during this year's "Tariff Tantrum", all of our accounts were in the black through it all. Typically, when markets rally in a meaningful way as they have the past few months, we trail. This month, we were able to outpace the S&P 500 by a bit, but that's unusual. Besting our benchmarks is common, but to beat the S&P 500 in a month like this is fortunate. Over time, my approach to risk management has paid dividends and allowed us to enjoy strong risk-adjusted returns.
I believe the balance of the decade is going to be defined by volatility. Each decade over the past 100+ years has been defined by a single theme. This decade's theme has, thus far, clearly been volatility. Volatility in the stock markets, volatility in the geopolitical sphere, and volatility across society in general. And, if the gut-wrenching volatility continues, effective risk management will continue to benefit us greatly.
As always, please do not hesitate to call us at 512-553-5151 if we can be of any assistance.
Best,
Matt McCracken
1) Inception date of 4/30/2019
2) All benchmark prices and returns are obtained through IBKR's PortfolioAnalyst reporting tool. S&P 500 Index is calculated using the index price. AOM is the iShares Core 40/60 Moderate Allocation ETF. AOR is the iShares Core 60/40 Balanced Allocation ETF. These benchmarks were chosen as they represent the prevailing investment strategies of retail advisors.
3) The Sortino ratio is a commonly used measure of "alpha" or the value a manager adds to a portfolio. It is similar to the Sharpe ratio. The Sortino ratio does emphasize the negative impact of downside volatility more than the Sharpe ratio which is why we use it as our primary measure of alpha.
