Performance Report: 06/30/2026
All performance data for our strategies is net of all fees and expenses. All performance data for indexes or other securities is from sources we believe to be reliable. All data is as of 06/30/2026
Investment Strategy
MAP - Full ($500k+)
MAP - Plus
MAP - Balanced
S&P 500 Index2
Mod Alloc(AOM)2
Growth Alloc (AOR)2
Jun Return
(7.5%)
(7.5%)
(3.0%)
(1.1%)
0.0%
(0.2%)
YTD
8.5%
5.5%
2.0%
9.5%
5.2%
7.4%
Inception1
115.0%
N/A
N/A
157.6%
55.5%
80.7%
Sortino3
1.21
N/A
N/A
0.87
0.59
0.73
(Disclosure: We added performance figures for our new strategies solely on a month-to-month and YTD basis as any prior data will be inconsistent and potentially misleading. We will post continuous data for our full-size MAP Strategy since its inception on 5/1/2019. We use AOM and AOR as our benchmarks as they are low-cost index funds that model the exposure of the majority of retail investors. Our risk measures are aligned closely with these funds. It is important to note that individual account performance varies and your account may perform better or worse than its model. The model's performance is simply the average performance of all accounts participating in the model.)
Performance Update
I'm not going to mince words. June was a really bad month for us. In fact, It was one of the worst months I've ever had. In his book, The Alchemy of Finance, legendary investor George Soros perfectly summarizes the problem that afflicts so many investors. To paraphrase Soros, investors seek to interpret reality through a lens that is distorted by their own desires. This distorted lens leads them to make subjective mistakes rather than assuming a rational, objective approach to investing. Thus, if we are losing money, it is because I'm failing to see the world objectively.
I'll admit that our incredible run last year must have "gone to my head". Compounding the issue was the manic state of markets following the invasion of Iran. I recently found myself in a "fog".
After numerous sleepless nights, continuously working through various ideas to solve the riddle that lay before me, the fog finally lifted. The vision for how we move forward has become all too clear. And for this reason, I'm wonderfully optimistic about what could be in store for the next few years.
Moving Forward
Properly explaining why I'm so optimistic about the future is complex. I'll need to expand on several ideas in order to adequately cover adjustments I'm making. Grab a drink, maybe a snack, get comfortable, and let's begin.
Every decade for the past 120+ years has been guided by a single overriding theme. Furthermore, there is a strong causal relationship from one decade to the next. The opportunities and issues from one decade invariably define the next decade.
1900's - Banking Panics: Panics were the norm throughout the 1900s. The Panic of 1907 gets all the press but there were others. Banking panics took place in the US in all the following years: 1901, 1903, 1905, and 1910.
1910's - The Birth of the FED: As a response to the 1900's banking panics, the FED was created in the 1910's. It was a decade-long process starting with the conception of the FED at the infamous Jekyll Island "First Name Club" meeting held in November of 1910. The Federal Reserve Act was passed by Congress on Christmas Eve of 1913. By 1915, the Federal Reserve System was operational. While the FED experienced birthing pains, the stock market endured a very rocky road. It was shut down for six months in 1914 and then fell over 40% in 1917. The stock market was either flat, down, or closed from 1910 until 1918.
1920's - The Roarding '20s: The newly minted FED, pun intended, provided some stability in the banking sector which allowed the American economy to start "hitting on all cylinders." The Roaring '20's was the single best decade for stock market returns until the 1990's. However, consistent gains and the FED's manipulation of key markets resulted in "irrational exuberance" with stock market valuations reaching an all-time high by 1929. It wouldn't be until 1999 that stocks would be as expensive as they were in 1929.
1930s - The Great(er) Depression: The best decade in the stock market was immediately followed by the worst ever decade in the stock market. Excessive speculation in the latter part of the 1920s, where even the shoe-shine boy had stock picks to offer, led to a massive valuation bubble that popped in late 1929. This gave way to the Great Depression. The DOW index fell 50% three different times from 1929 - 1938.
1940s - World War and Reconstruction: Rampant inflation in the 1920's coupled with a worldwide depression in the 1930's resulted in the rise of the autocratic Nazi Party in Germany, which ultimately led to WWII. The stock market of the 1940s was defined by both WWII and the subsequent reconstruction. In an attempt to reign in inflation, Allied forces agreed to a new monetary regime where the entire world would use gold-backed US dollars as the primary trading currency.
1950's - Cold War, Hot Stock Market: The reconstruction after WWII was very, very good for America. The 1950s were marked by rapid growth in the US where the stock market did not suffer a single bear market for the entire 10-year span. Not only did US manufacturing provide the world with much-needed goods, but the US dollar also became the de facto worldwide reserve currency. The stable US dollar was a welcome change for European investors. Money from overseas flowed freely into the US, supporting our stock and bond markets.
1960s - Unrest everywhere: The '60's were defined by social, cultural, racial and political unrest. And the stock market followed suit. The decade began with the 3-year Kennedy Slide. Stocks went up and went down for the span of 3 years without achieving anything meaningful. Then back-to-back corrections in 1966 and 1967 contributed to more volatility. While the newly minted world reserve currency fared well throughout the 1950s, it afforded the US government the short-term luxury of running deficits to fund various military actions. During the 1960's, US trading partners began to doubt the legitimacy of the US Gold Standard under the Bretton Woods system.
1970's - Stagflation: As a result of deficit spending in the 1960's, the Gold Standard established by the Bretton Woods Agreement finally failed. In December of 1970, gold broke free of its US Dollar peg. Seven months later, Nixon would formally abolished the Bretton Woods agreement ending the gold backing of the US dollar. Subsequently, the US dollar collapses in value. During the subsequent 10 years, now known as the '70s Stagflation, the US stock market would fail to deliver positive real returns, while the prices of hard assets like gold and oil would increase several thousand percent. Imagine if one could have known to sell their "Nifty Fifty" stocks in 1970 and buy gold and oil?
1980s - Globalization: The collapse of the value of the US Dollar in 1971 forced the FED to create an ingenious alternative - the Petrodollar. In exchange for defending the Middle East and providing it adequate weaponry, the US Treasury and FED convinced OPEC to price oil solely in US Dollars. In return, all Petrodollars would be recycled into defense products provided by the US defense companies or into US Treasuries. No matter where you laid your head at night, you had to first buy US dollars to buy oil. This reestablished the US Dollar's footing as the world's reserve currency.
Further, the US needed to "export inflation". Developing economies in the Far East provided inexpensive labor and materials. These forces resulted in globalization. It started in Japan in the 1970's and then spread to all corners of Asia by the 2000s. Imagine if one could have dumped their gold and silver in 1980 and bought the NIKKEI index?
1990s - An Idea and Capital: Globalization led to the proliferation of new innovations at lower prices. Computers became mainstream. Some people started connecting those computers via telephone lines so the computers could talk to each other. I graduated college in 1995 and I was never even assigned an ".edu" e-mail address. By the end of the decade, I, and just about every other American, had relied on the internet on a daily basis. What a remarkable transformation in just 5 years.
The economic growth spurred by the internet was nothing short of incredible. And it resulted in a fantastic fury of stock speculating resulting in the highest valuation for US stocks since 1929. Imagine if one had dumped his NIKKEI shares in 1990 and gone all-in with Microsoft, JDS Uniphase, and Cisco.
2000's - Intangible to Tangible: Predictably, the obscene speculation that defined the late 1990's dot.com bubble gave way to the early 20000's dot.bomb recession. The ever-vigilant FED lowered interest rates far below inflation to resuscitate the economy. Burned by dot.com stocks just a few years earlier, investors turned to "brick-and-mortar". Housing prices skyrocketed. As did anything else that was tangible. Oil appreciated several thousand percent, as did gold, copper, and sugar. Within a few years, the same investors that paid far too high a price for "invincible" tech stocks determined that "housing prices would never go down" and paid an even more outrageous multiple for real estate-related ventures. And once again, the bubble popped. The 2000's were the only time outside of the 1930's where the stock market fell 50% more than once in a 10-year span. Again, imagine if someone were sharp enough to sell all their dot.com stocks in 2000 and reinvest their profits in homes, oil, or gold?
2010's - QE "Set it and Forget it": As a fallout of the Great Recession in 2008, in November of 2010, the FED was given the blank check it always sought - Quantitative Easing. Prior to QE, the FED had guardrails that had "prevented" them from being able to navigate events like the 2008 Financial Crisis. The 2010s were a magical time in the stock market akin to the 1950s, where stocks went straight up; anytime there was a "blip", bonds rallied to fill in the gaps.
2020s - Asymmetrical Markets: The math is pretty easy to understand. Monetary Malfeasance x Malinvestment = Supply Shortages. The past 6+ years have been defined by unprecedented money printing, which has created supply-and-demand imbalances and shortages. Whenever those shortages or imbalances become obvious, securities go Asymmetrical (meaning straight up or straight down). Here is a chart that I've shared a few times before which illustrates how the FED has printed an endless amount of money to paper over any holes that may threaten the economy:

So far this decade, each and every year has been defined by a sector of securities that go parabolic - or straight up. Here is the rundown:
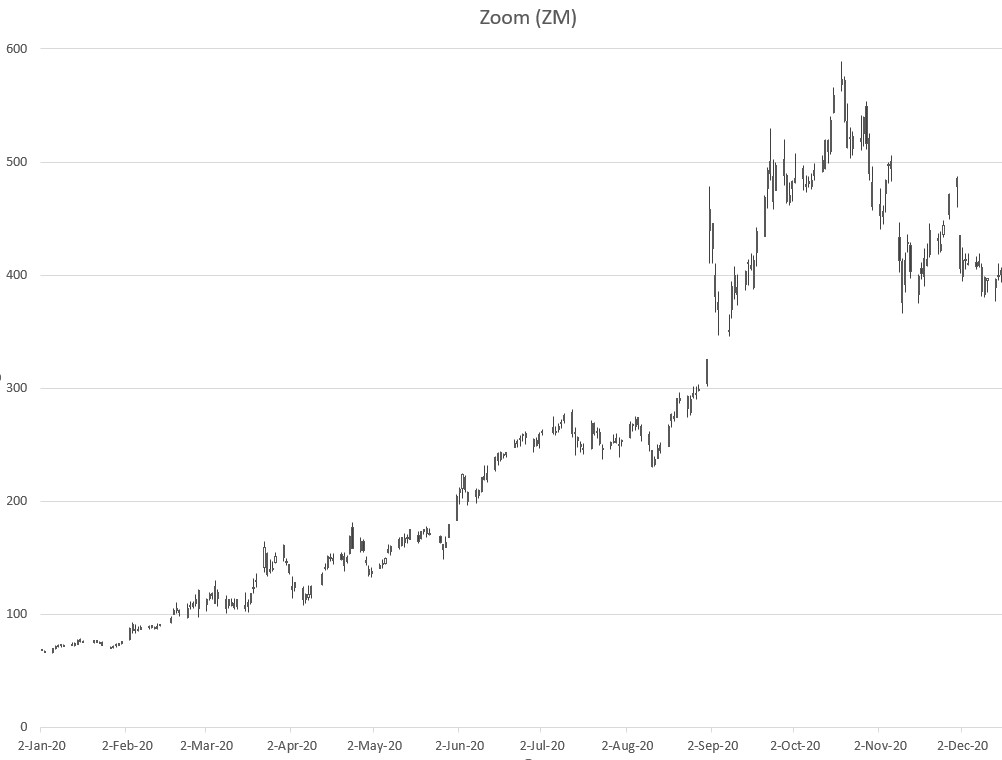
KEY TAKE AWAY: Every year, something seems to engage in a parabolic move higher. 200% gains have become commonplace if you just know where to place your capital. Granted, many of these securities have given back some or even all their gains. But if we have a systme to lock in profits, we don't have to give back all our gains.
Capital markets have alternated between asymmetrical moves both higher and lower. Nothing sits still in this market as too many dollars chasing too few securities has created a wild, untamed capital market environment. There are two quotes I'd like to share from two legendary investors that do an adequate job of explaining this phenomenon in rather simple terms.
The cure for high prices is high prices.
- Jim Rogers
Capital is always fighting to be recycled.
- Michael Burry
Since the $5T monetary "moon shot" in April of 2020, the FED's printing press has reached terminal velocity. To the FED's credit, they have largely contained price inflation remarkably well given the obscene amount of monetary inflation they have created. Money has continued to reside in the capital markets rather than flowing freely into the economy at large. Yes, stock market gains can result in a wealth effect but the impact on price inflation has been muted.
We have benefited from several of the large parabolic moves higher over the past 6+ years. And just as importantly, we have avoided the asymmetrical moves lower in stock market indexes throughout this decade. Three times the stock market has fallen 20% or more. Twice we avoided it entirely and once we experienced modest losses while others saw double-digit declines. But that is all in the past. What I have done for you lately...
HOW WE MOVE FORWARD:
My goal for the foreseeable future is singular in purpose. Identify the next asymmetrical move higher while avoiding all asymmetrical moves lower. The following will improve our odds of achieving my objective.
1) Continue to implement my strict risk-management processes. As I addressed in last month's update, I've made some adjustments to my risk-management process to account for the increase in overnight activity. Our positions will be smaller and contain less risk. However, we will likely have more positions so our overall exposure should be in the same ballpark. I am growing increasingly concerned about an impending collapse in Private Credit. And a crash in Private Credit could result in contagion wiping out gains across all securities. It would be the first time the FED allowed things to get out of control since they were handed the keys to the QE printing machine. I wouldn't rule it out, but I wouldn't count on it either. If the Private Credit markets do collapse, it will be painful for cyclical stocks and I will continue to steer clear of them.
2) On the buy side, I will cast a much wider net. Admittedly, I have been too focused on investment themes that "jived" with my global/macro outlook. And in my defense, up until about 3 months ago, nearly all security sectors were sublimely correlated. Even gold and oil were positively correlated to tech stocks. Throughout the 2010's bonds showed a clear negative correlation to stocks, but even that flipped in 2022. If money was coming into the markets, everything went up. And when the market got scared, everything went down. It has truly been quite odd. Today, capital markets are behaving more like those ping-pong balls in the lottery machine, bouncing around in every direction, at a torrid pace that is difficult to follow.
But I have an "ace up my sleeve". I have a system that clearly identifies liquidity flows. If I just have enough coverage, I should be able to adquately identify "The NEXT BIG THING." I have decided on a several investment themes which I believe could benefit from shortages in the future. They are:
- Robots: Our nation is exporting quite a bit of labor capacity. Even non-resident aliens who are in the US legally are finding the situation untenable and looking to move back home. I don't care to get into the morality or the politics, just the economics. Foreign citizens residing in our country do a lot of jobs that would otherwise not get done. We'll have to replace their efforts. And to do so, America will do what America does. Innovate. I've added 4 companies focused on the robotic space that I will buy upon the MAPs instructions.
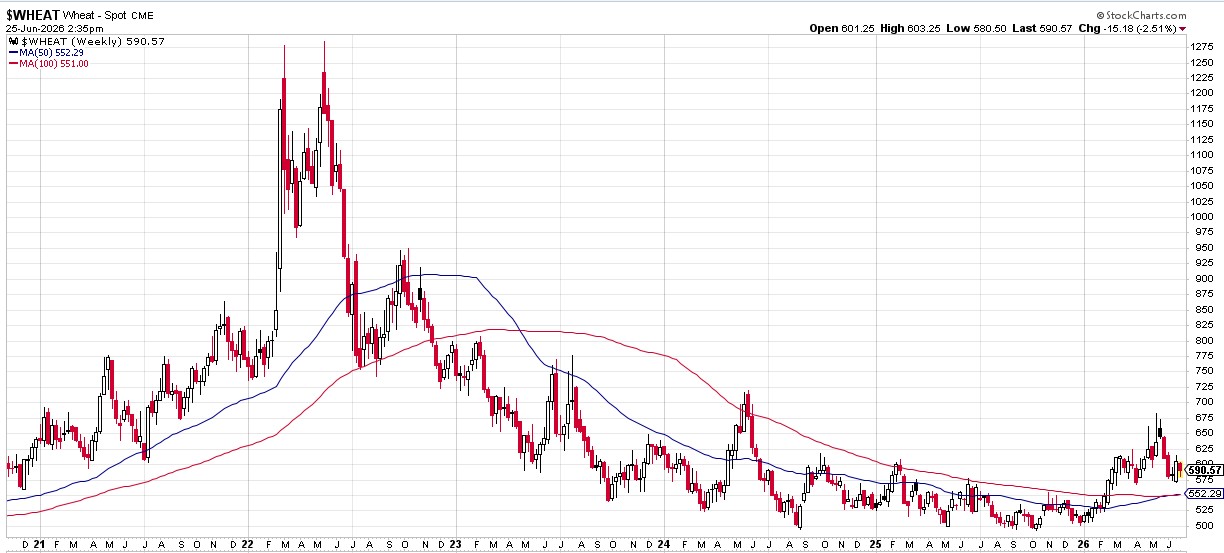
- Ag products: I get this one hurts but pretending it won't happen won't make it not happen. For 15 years, the FED has been proactively suppressing the price of ag products to keep inflation in check. I'll focus on wheat prices but I could cover at least a dozen physical commodities where it is evident the FED is shorting paper futures to influence physical prices. Today, December '27 wheat (ZC'27) is trading at a near 20% premium to the current spot price. This premium, what Wall Street calls "Contango", is unprecedented. Further, it proves someone has a massive net short position in the commodity. The short position will profit if the price of wheat remains stable at current levels. Thus, we know Wall Street bankers and the FED are on the short side of the trade. This scheme has resulted in malinvestment in the ag space. At some point, a shortage situation could emerge and if it does, the speculative shorts (i.e. Wall Street) will be squeezed until all their liquidity is exhausted. We already had several ag names in my MAP system but I've added a few more.
- Jet Fuel: If, and this is a big IF, the situation in the Middle East is not resolved soon, there could be shortages of various distillate products. This one will be a challenging security to invest in for most accounts but it is possible for larger accounts approved for futures.
- Fertilizer: Again, this is a Middle East play. Fertilizer requires natural gas for production and given that the Middle East produces copious amounts of natural gas as a byproduct of oil, far more than they need, there are fertilizer plants up and down the Persian Gulf. We have featured Mosiac and Nutrien for quite some time and now I've added a couple more domestic fertilizer producers to the MAP.
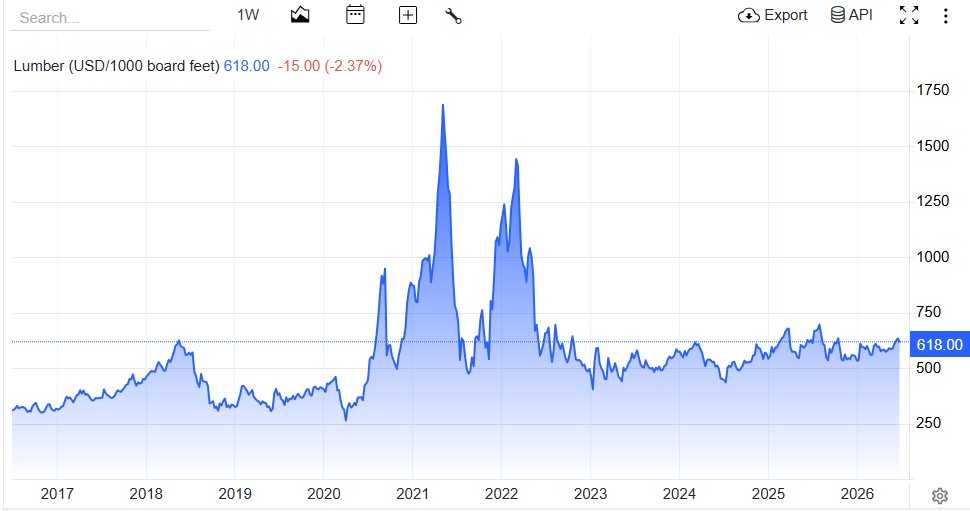
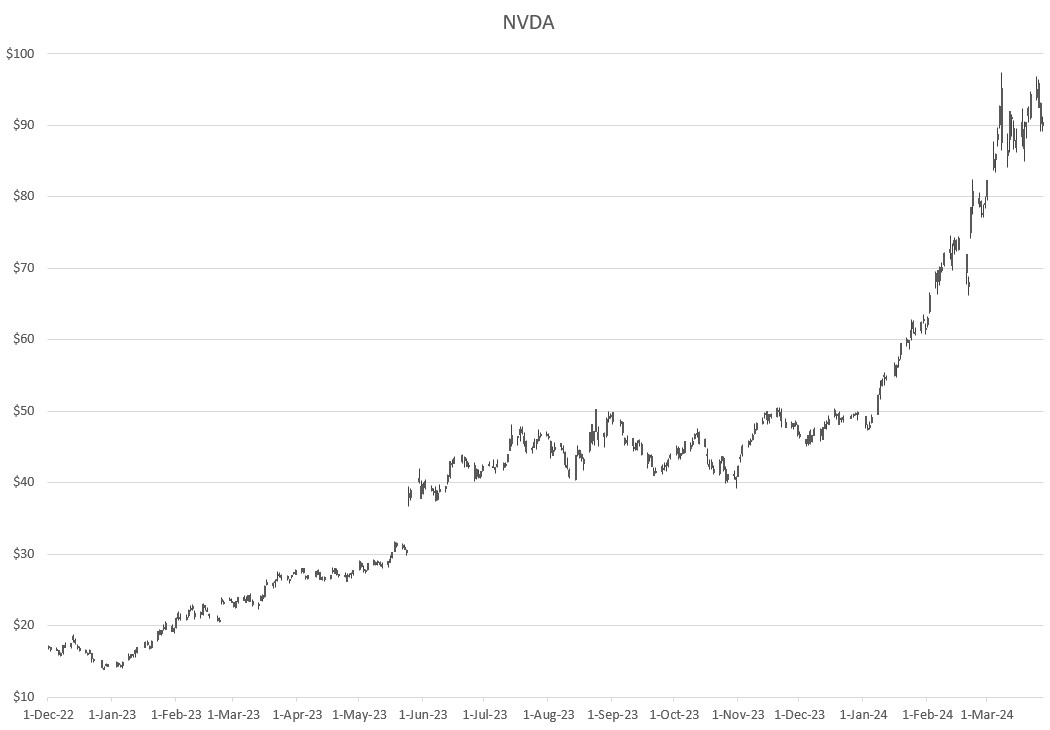
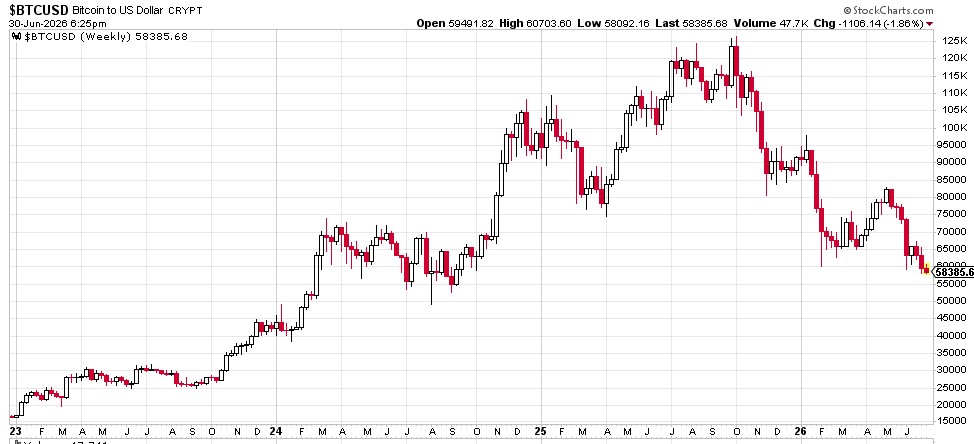
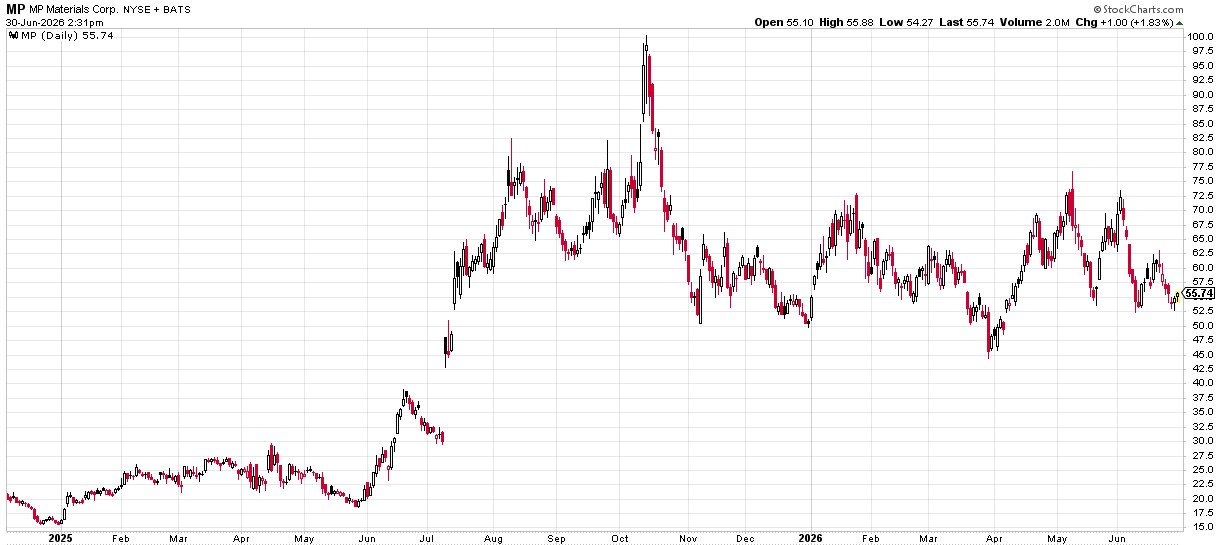
- Precious Materials. I'm including rare earth miners as well as the precious metal miners. Historically, stocks that go parabolic will do so in at least two waves. We are currently seeing this with microchip stocks. Bitcoin experienced two waves. Lumber also experienced two waves, first in 2019, then again in 2021. I am expecting a second wave for rare-earth and precious-metal miners. It's common for the subsequent wave to be even bigger than the first. It was rumored that there was a silver shortage in the Comex vaults late last year. And even our VP has readily admitted that we are short rare earth metals. I've had sufficient precious metal miners in the MAP all along; some would argue too many. I have added a couple rare earth miners to the ones I already had in the system.
- Electricity: We have had strong exposure to power generation in the form of uranium and coal. I have added some alternative energy names as well, specifically solar power. When Trump was elected, given his disinclination towards global warming, I mistakenly removed all my alternative energy names. But the market has decided that the need for power is so insatiable, solar has a place even if it does not stand to benefit from government assistance. I've added a few solar power names as well.
- Drones: It is abundantly clear that the future of warfare lies in drones. And given that they are being readily shot down and destroyed, it seems plausible that a shortage situation may emerge. I was surprised to see how cheap some of these stocks are. I've added a half dozen and already bought small positions in a couple of them for you.
- Trade War: Heightened sanctions could lead to a reduced supply of parts, which seemingly all come from China. One way to defend against this would be to invest in 3-D printers. For some time, we've had the only two domestic plays in this space in the MAP, but I haven't maintained any real exposure to them. I expect that may change.
- Sound Credit Opportunities: If Private Credit collapses, it will trigger a "flight to safety". This will likely include US Treasuries and possibly gold and silver. It is possible for our accounts approved to futures to maintain meaningful exposure to gold while retaining 95% of the yield of US Treasuries. In some of my larger accounts, we can bet against proxies for Private Credit, which I'm currently doing, but it's not something I could do across the board for all clients. If Private Credit does collapse, the primary beneficiary will be those holding cash who buy up shares cheap on the other side.
In addition to these themes, I'm adding some China-based stocks as they are reaching a deeply oversold status. Several of these names are down 50% from their all-time highs versus a good number of domestic equities that are at all-time highs.
Finally, I've made some key adjustments to my MAP system to make scans for stocks far quicker so I can track more names. The adjustments I have made should allow me to track at least twice as many stocks in the same amount of time. My goal is to obtain broader coverage across more sectors but not to increase our overall exposure to the capital markets. I simply doubled the names in the MAP but I'll be cutting the size of the positions by at least half (12.5 bps of risk versus 25bps of risk).
Conclusion
Again, my failure the past few months has been due to my subjective misinterpretation of the reality of the stock markets. I missed the parabolic move higher in chip stocks as I had decided that the stock market had pushed valuations to such an extreme level that prices couldn't go much higher. At times like this, it has been prudent to stay away from cyclical securities such as technology. And to my credit, a great number of cyclical names did fall this month. The MAG 7, which have buoyed the stock market for the past several years, experienced a double-digit decline on average in June. But chip stocks did go vertical while other stocks that stood to benefit from lower oil prices recovered much of their losses.
Now that is behind us. There is nothing I can do about missing the move in chip stocks the past two months. It is my responsibility to make the necessary adjustments to position us better moving forward. The market is always changing, thus I need to always be adjusting. And adjust I have. When sitting down with many of you, I've said, "I can't promise I'll always beat the market, but I can promise that I won't ever stop trying." Complacency is the enemy and I'll avoid it at all costs. The adjustments I made this month will bear fruit as I identify future asymmetrical moves in the capital markets.
As always, please don't hesitate to call us at 512-553-5151 if we can be of any assistance.
Best,
Matt McCracken
1) Inception date of 4/30/2019
2) All benchmark prices and returns are obtained through IBKR's PortfolioAnalyst reporting tool. S&P 500 Index is calculated using the index price. AOM is the iShares Core 40/60 Moderate Allocation ETF. AOR is the iShares Core 60/40 Balanced Allocation ETF. These benchmarks were chosen as they represent the prevailing investment strategies of retail advisors.
3) The Sortino ratio is a commonly used measure of "alpha" or the value a manager adds to a portfolio. It is similar to the Sharpe ratio. The Sortino ratio does emphasize the negative impact of downside volatility more than the Sharpe ratio which is why we use it as our primary measure of alpha.